SSD Performance Profiling
The code written and used for this project can be found here.
Process
This project assignment details using FIO, a Flexible I/O Tester commonly used for local benchmarking. The version used for the following results was the latest release at the time of writing, version 3.38. As stated in their HOWTO.txt file, FIO has a couple baseline parameters that are modified in testing.
- I/O Type (Read vs. Write ratios in increments of 10%)
- Block Size (4KB/16KB/32KB/128KB as specified)
- I/O Size (amount of data to be read/wrote)
- I/O Engine (how to issue I/O)
- I/O Depth (queuing depth)
- Target File/Device (my laptop)
- Threads, processes, and job synchronization
From our project description, we have a few parameters fixed as described above. The rest we can adjust to accommodate reasonable performance/runtime and to clarify the desired results. For testing with FIO, ChatGPT recommends safe I/O sizes from 4KB to 128KB, where lower range sizes are more common for random read/write testing while higher range sizes are often used for sequential testing. Since we are trying to work with SSD performance in particular, it makes more sense to ensure that the I/O size we are working with is larger than the available caches on my device to simulate a more realistic functioning case. As such, we will be using an I/O Size of 1GB, which is larger than most caches and big enough to accommodate the sizes of data blocks we wish to access. The I/O depth will be varied between 0 and 1024, in increments of powers of 2 to display the effects of queue size. This translates to certain test options:
rw=read/write/randread/randwrite/randrwbs=4K/16K/32K/64K/128Ksize=1Gioengine=windowsaio(Linux users use libaio)iodepth=4/8/16/32/64/128/256/512/1024direct=1(use nonbuffered I/O)output="filename"output-format=jsonruntime=60andtime_based(to ensure consistent, stable results by allowing SSD to reach steady-state performance)group_reporting(compile results for easier analysis)thread(to address a fio running error)stonewall(to prevent simultaneous execution of multiple jobs - my computer will spontaneously combust otherwise)
Part 1: Impacts of Data Access Size
To test this, I needed to isolate the various block sizes of 4KB, 16KB, 32KB, 64KB, and 128KB. As such, I ran with 2 cases for each block size: rw=randread and rw=randwrite. This lets us analyze performance in isolated cases of random read or write operations, which is admittedly not fully demonstrative of cases where is a mix of read and write operations. However, we are able to get a good idea of the behavioral trends overall.
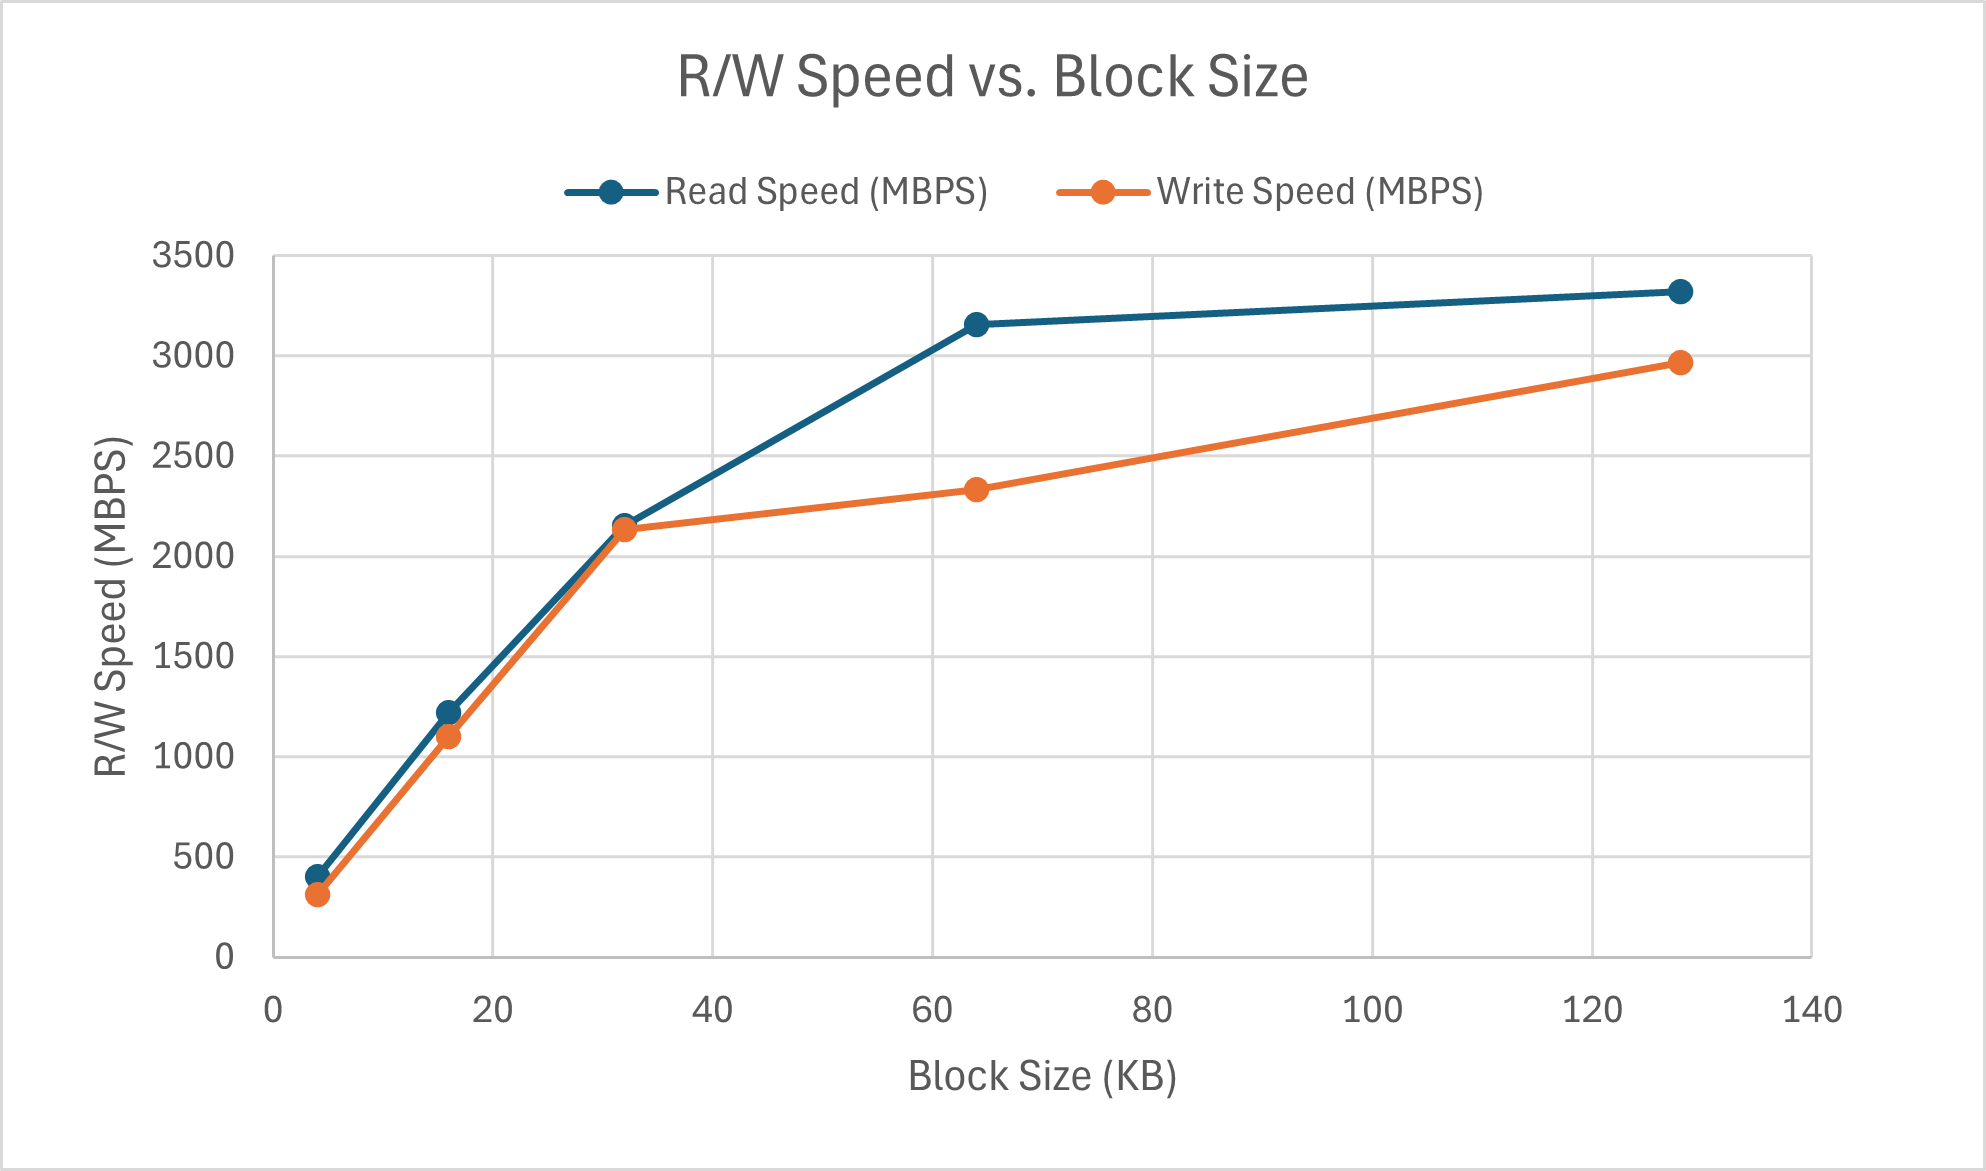
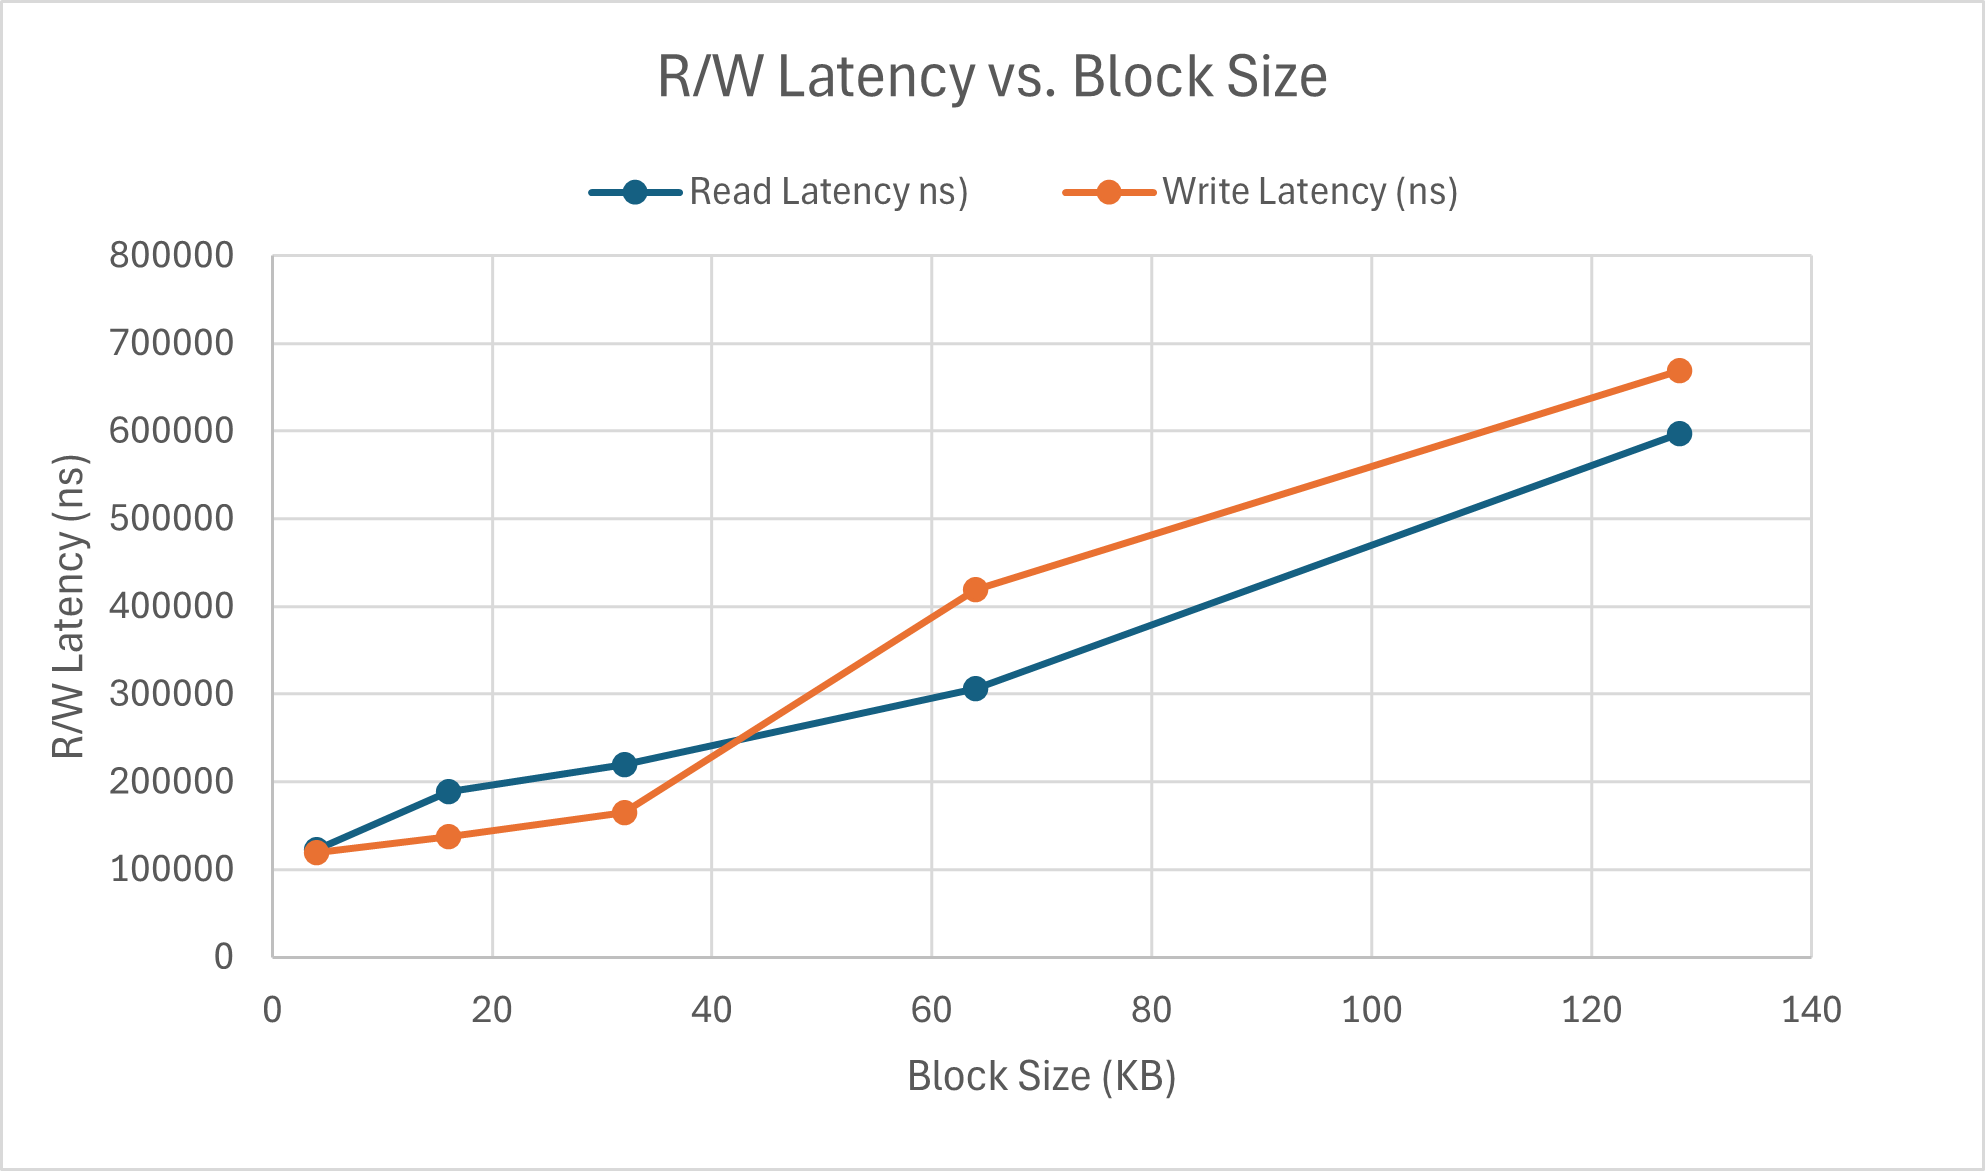
First off, these latency values are in nanoseconds, or 10^(-9), which is an incredibly small value. Even at the maximum, there is only roughly 7ms for write and the overall range over the change in block size is less than 5 milliseconds. Thus block size appears to have minimal impact on R/W latency. Interestingly enough, the write latency faster than read latency for operations with block sizes under approximately 45KB. This actually allows write operations to executed at a speed almost on par with read operations. This is likely due to reduced write conflicts being encountered since each memory access is smaller in size. However, as block size continues to scale, the latency of write operations is generally higher than read operations, as expected. For subsequent parts, I continued to test at 2 different block sizes, 4KB and 128KB. The 4KB case replicates a common random access pattern for SSDs in real-world usage, whereas 128KB provides insight on sequential memory accesses or sustained throughput performance cases.
Part 2: Impacts of Read/Write Intensity
Incrementing the read vs. write ratio by percentages of 10 yet again to match previous experimental results for a similar question regarding cache performance, the results for block size 4KB can be seen below.
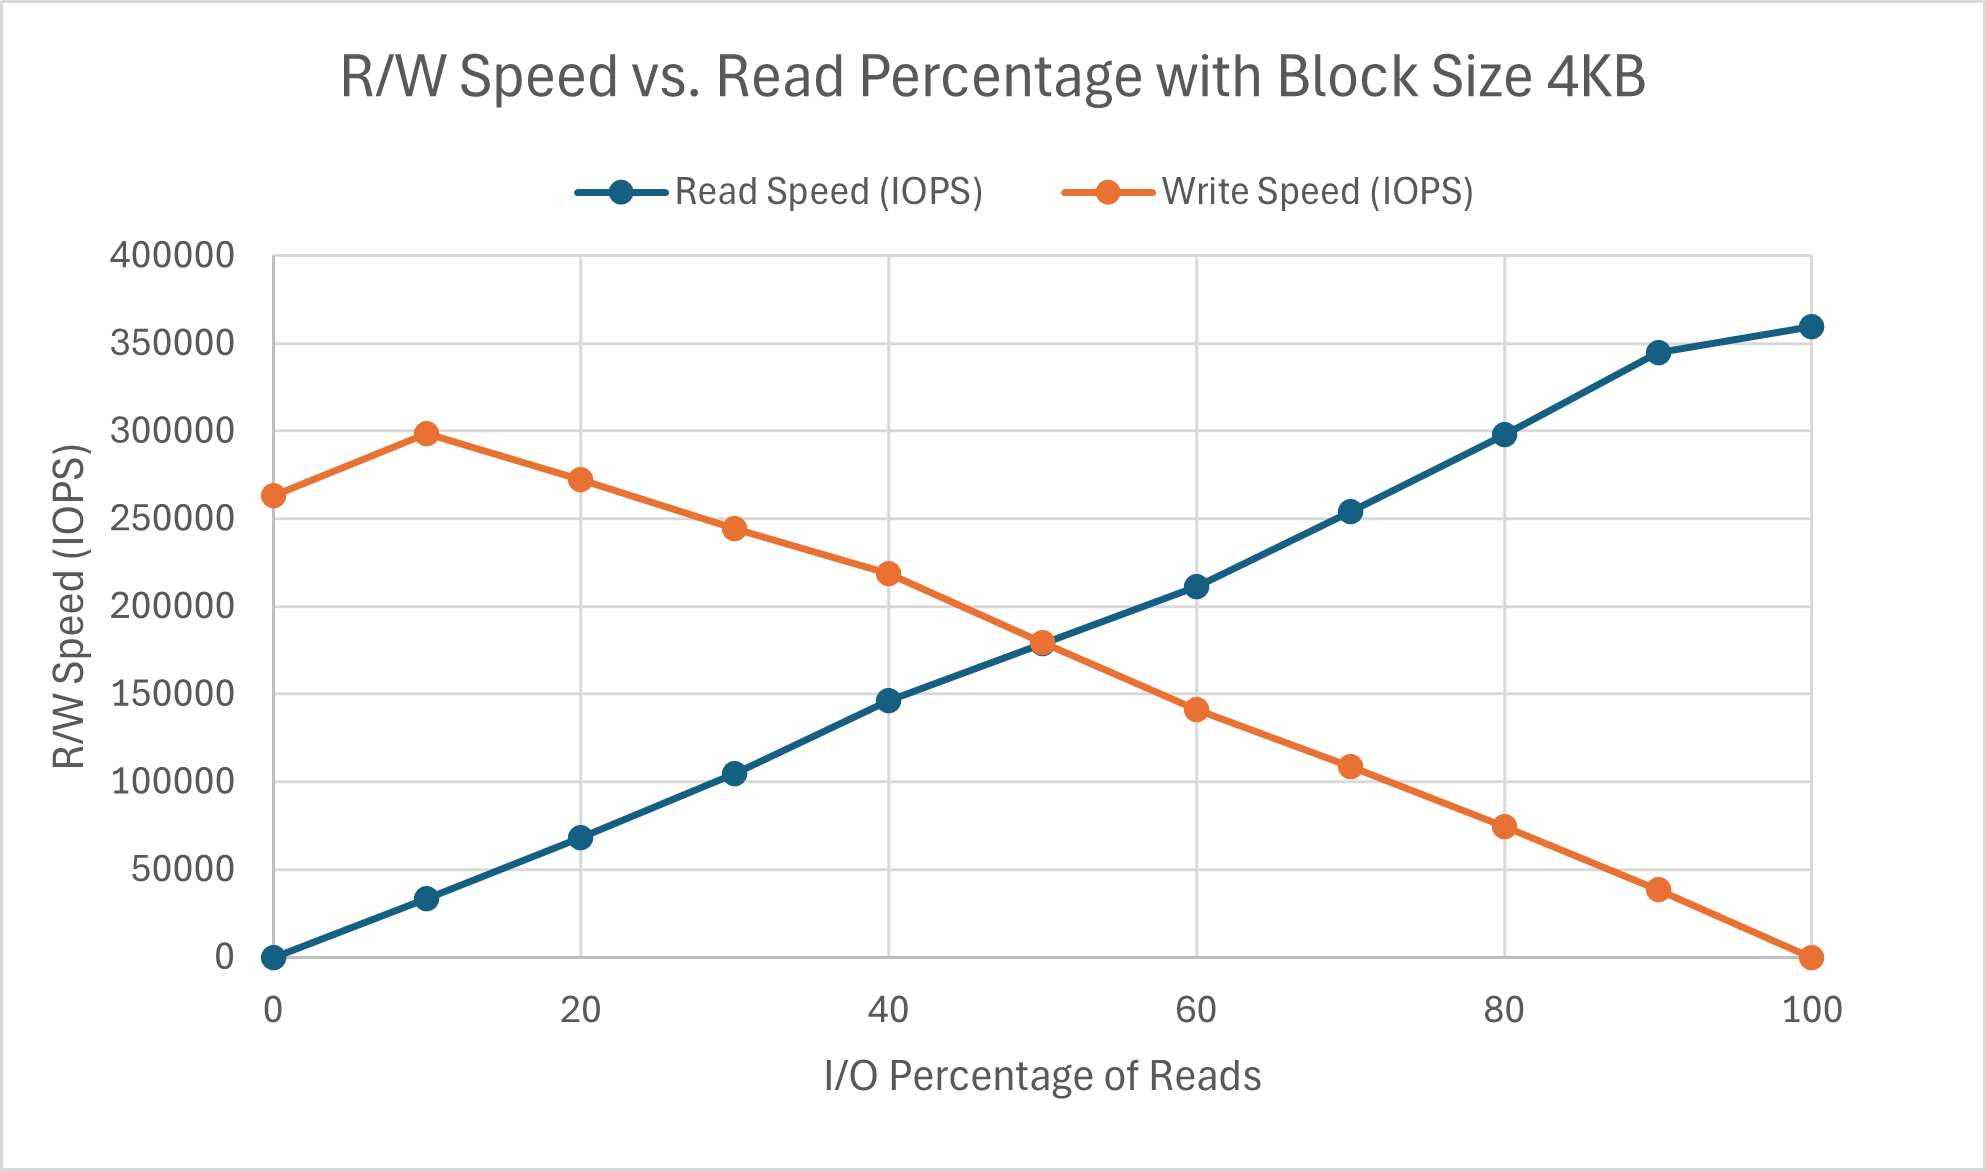
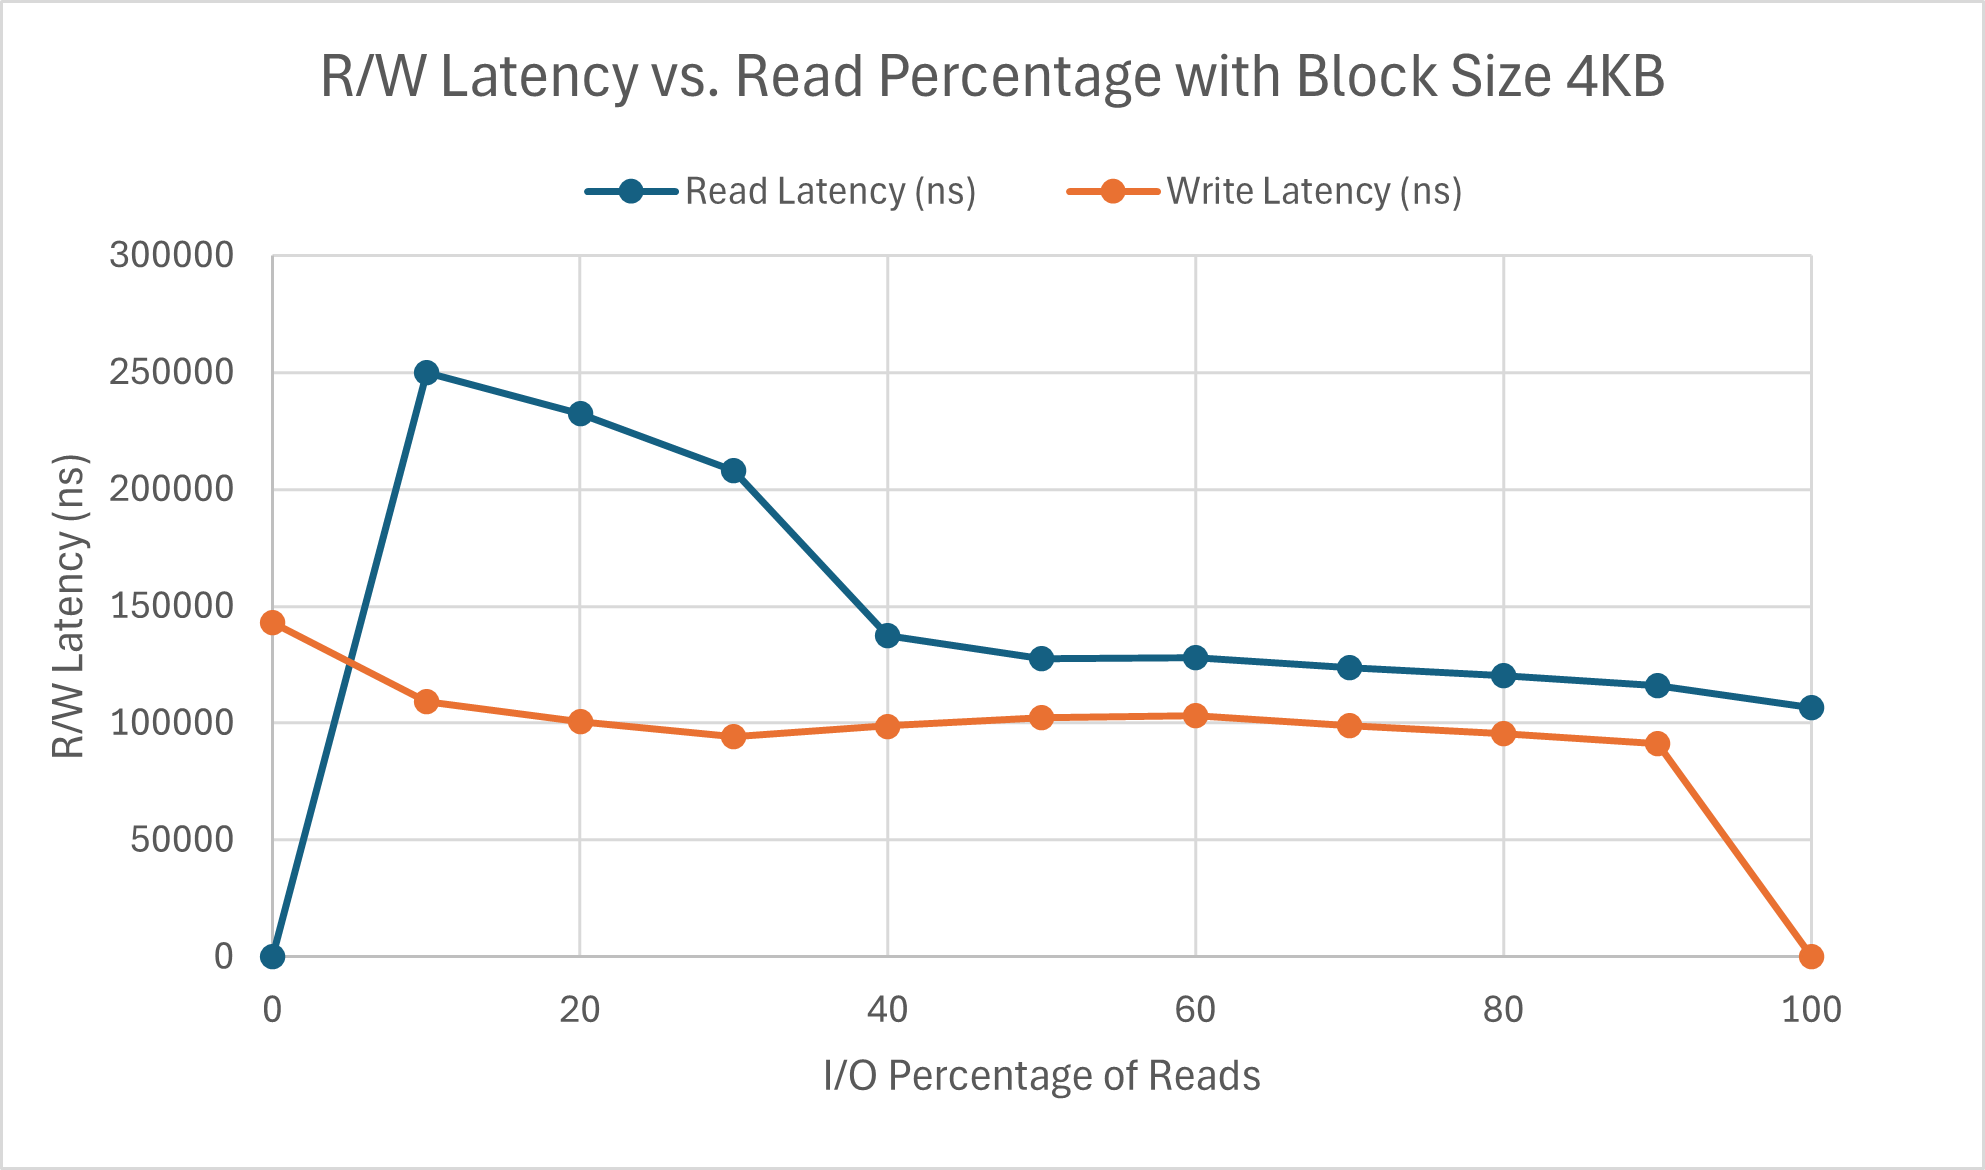
The speed of both operations are quite linear and, as expected, inversely correlated. Interesting to note is that beyond the 90% threshold for both operations, the performance speed drops - only slightly for reads, but quite substantially for writes. The write latency is generally more consistent and lower than the read latency at each percentage, with the only exception being when it is write-only. The increased write latency is likely what causes the drop in speed. Read latency in particular drops quite substantially after at least 40% of operations are reads. However, the impacts of this drop cannot be seen at all by the speed, indicating other confounding factors. Further results for block size 128KB are shown below.
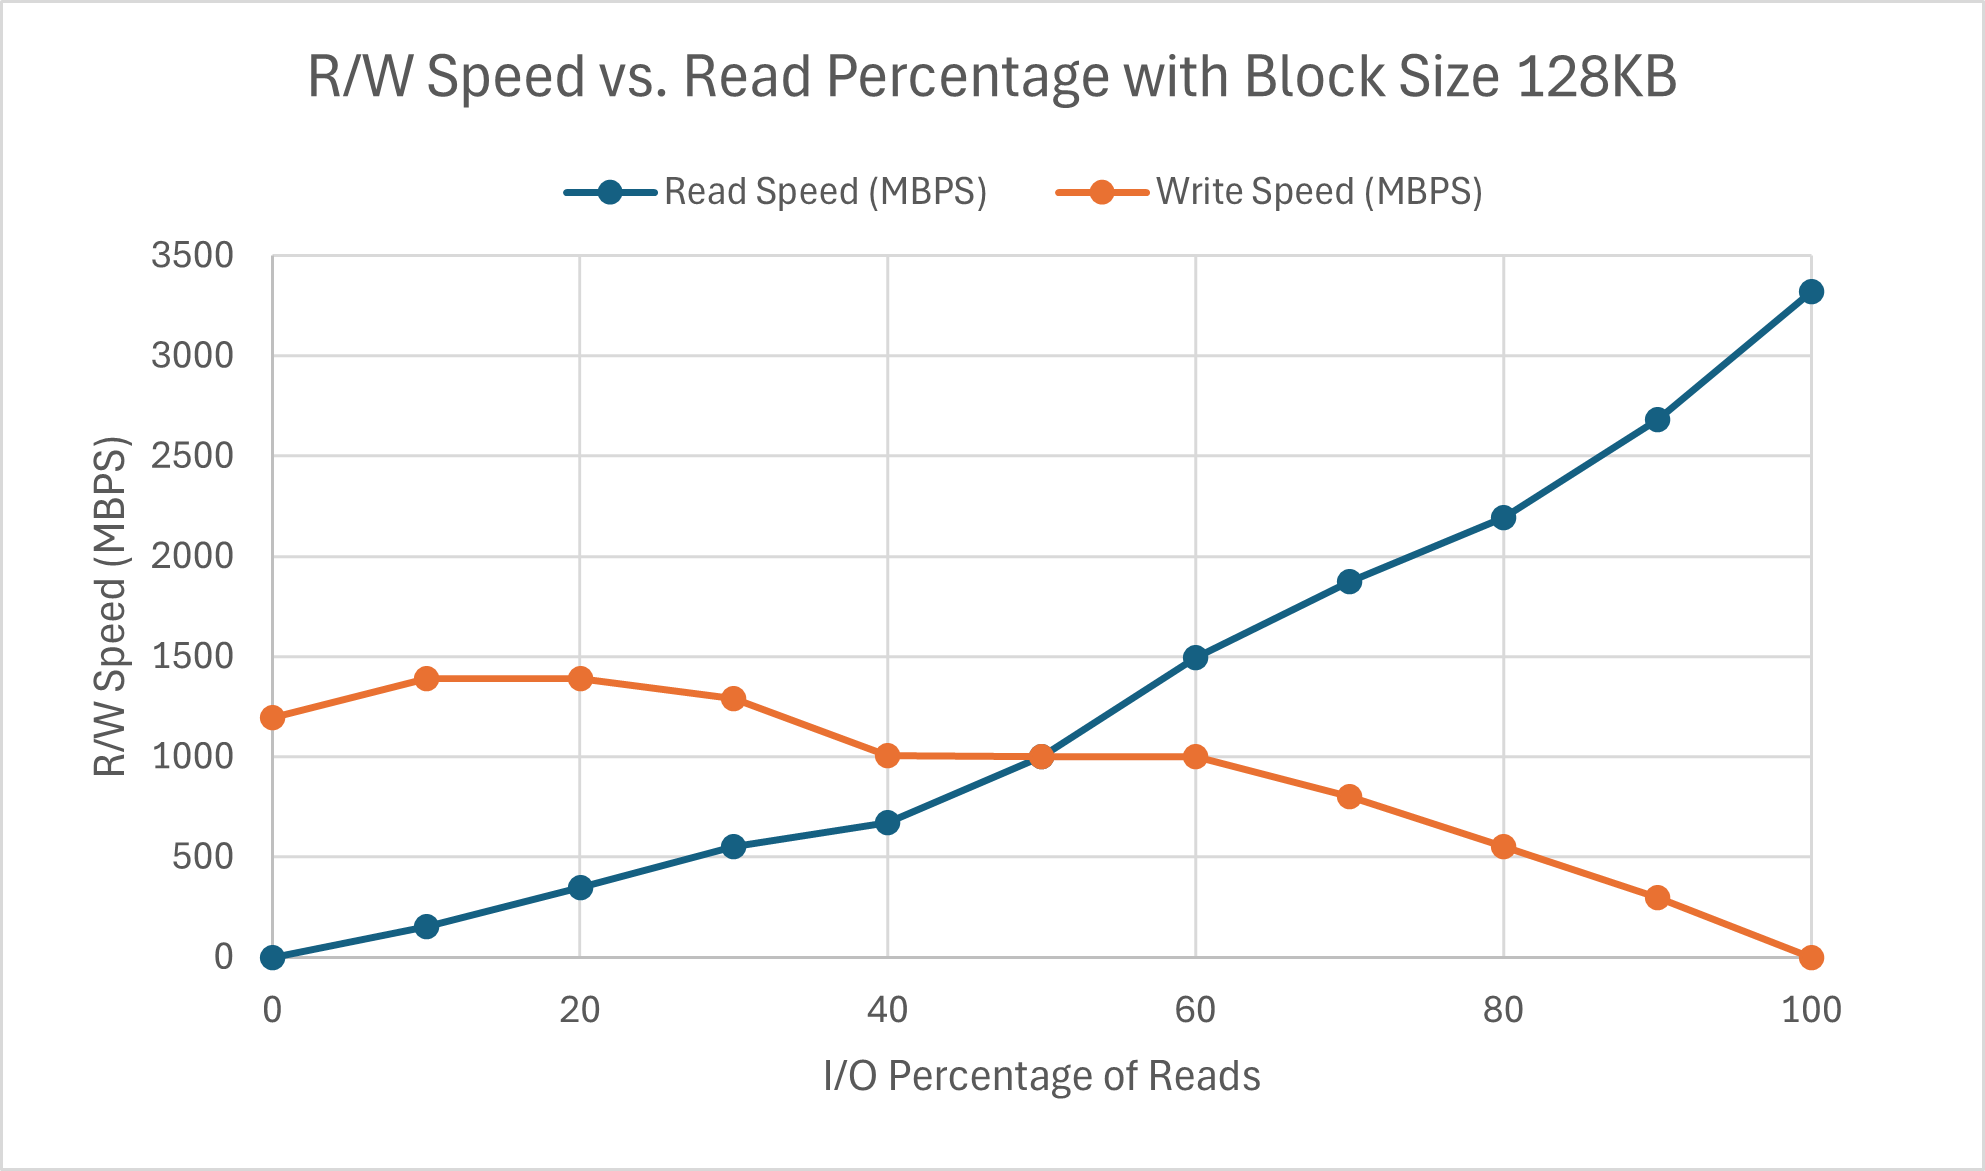
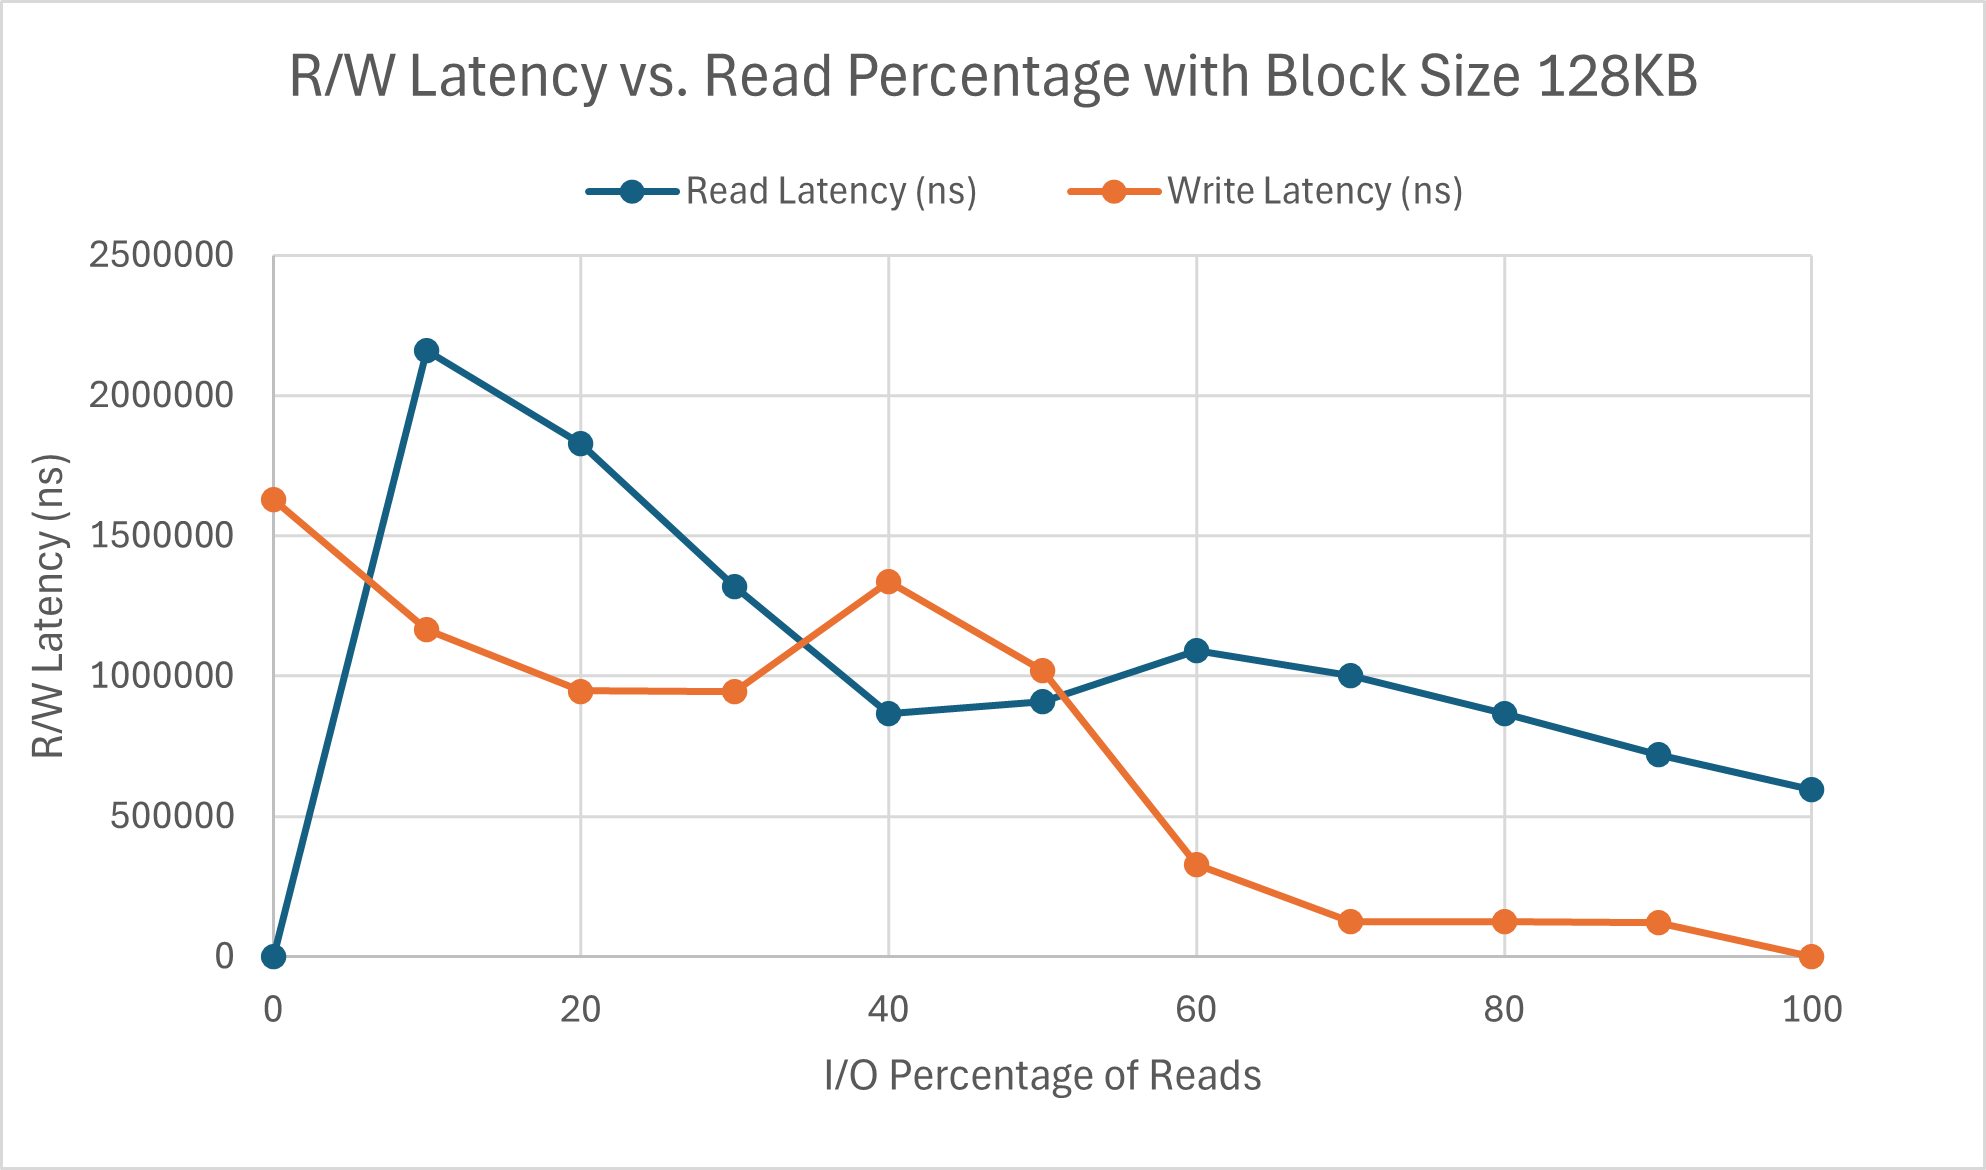
Being careful to note that the speed axis is on a completely different scale compared to the 4KB graphs, we see that the graph is less linear. Additionally, unlike the read speed which appears to maintain approximately the same rate of change as its behavior with block size 4KB, the slope of write speed is roughly half of its 4KB counterpart. It appears to plateau after write percentage goes over 40%, with very minimal increase henceforth. The latency graph for block size 128 KB looks quite wonky. Though the trend overall stays consistent (write latency being lower than read latency), there is an interesting peak in write latency at 40:60 read vs write. There is a chance that this may be due to randomness, however the point matches the 4KB drop in read latency. This is likely due to the write conflicts that we start encountering as the percentage of writes increases, which we did not evaluate for in Part 1. Other than that, the higher block size results in almost a ten-fold increase in MBPS for reads, but only a roughly five-fold increase for writes.
Part 3: Impacts of Queue Depth
For the purposes of this section, I/O depth and queue depth refer to the same thing. I chose increments in powers of 2 between 0 and 1024 with the same 2 cases as part 1 for consistency in test cases and hopefully easier comparison. This ended up taking a really long time to finish running (due to the runtime restriction I set), however I wanted to maintain the same testing parameters if possible across all cases. The outputs are as shown.
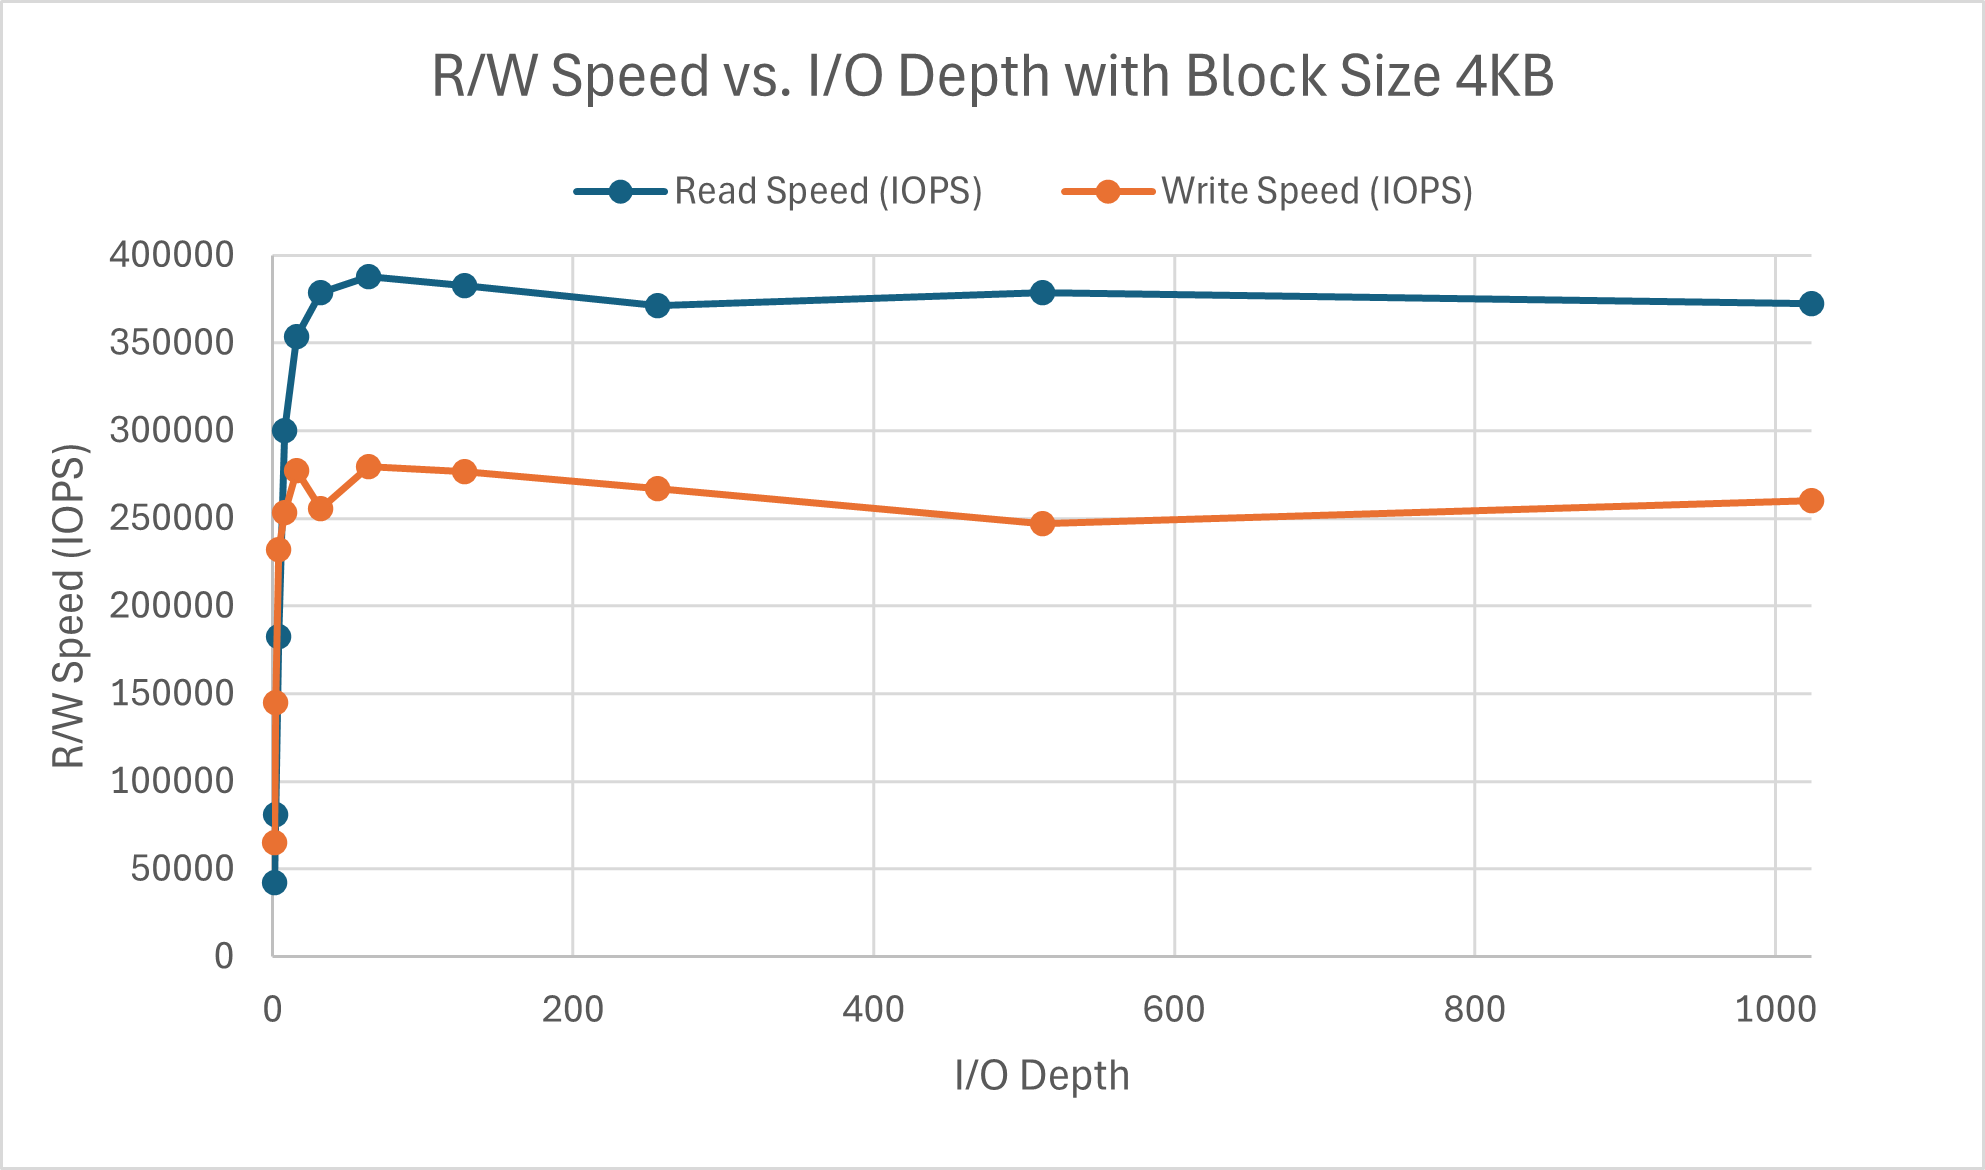
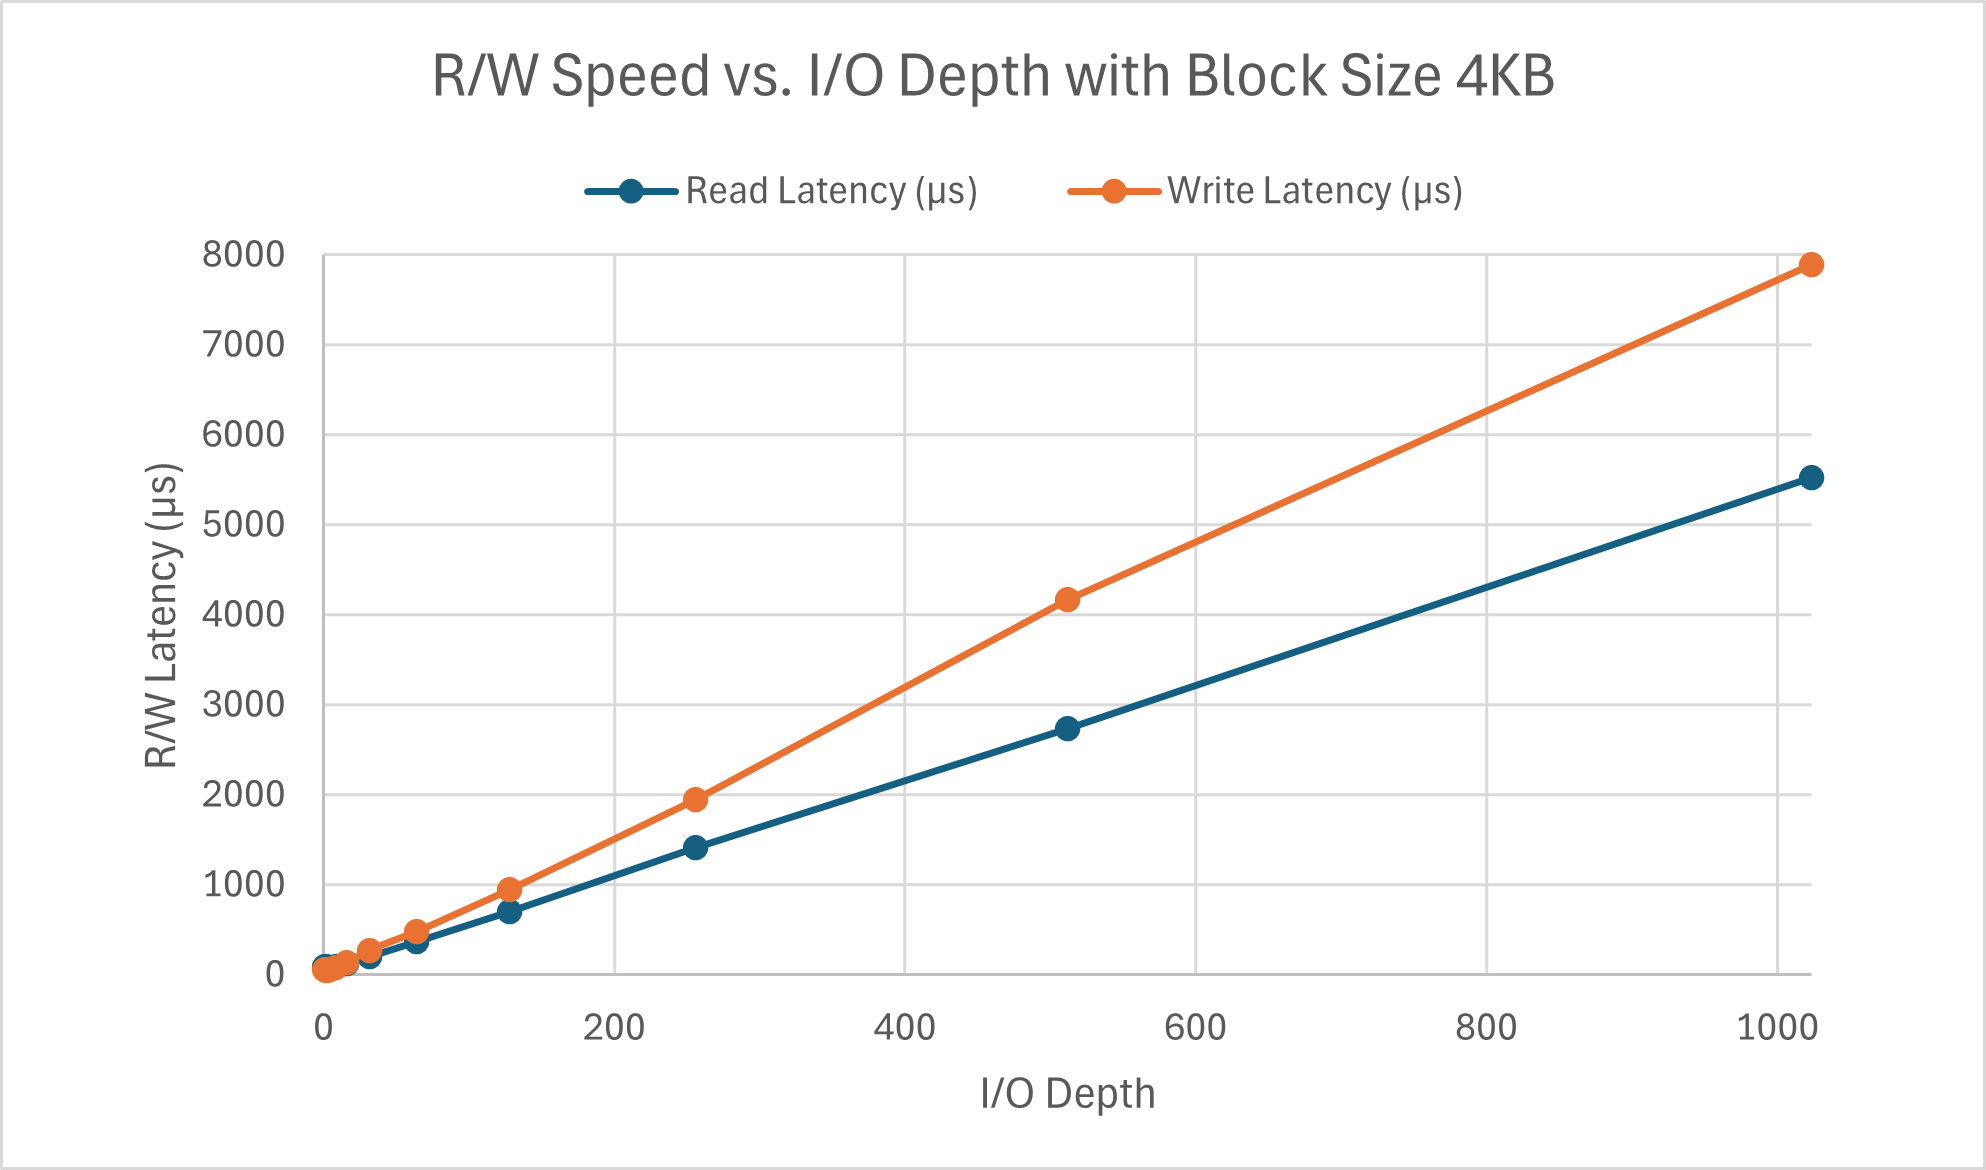
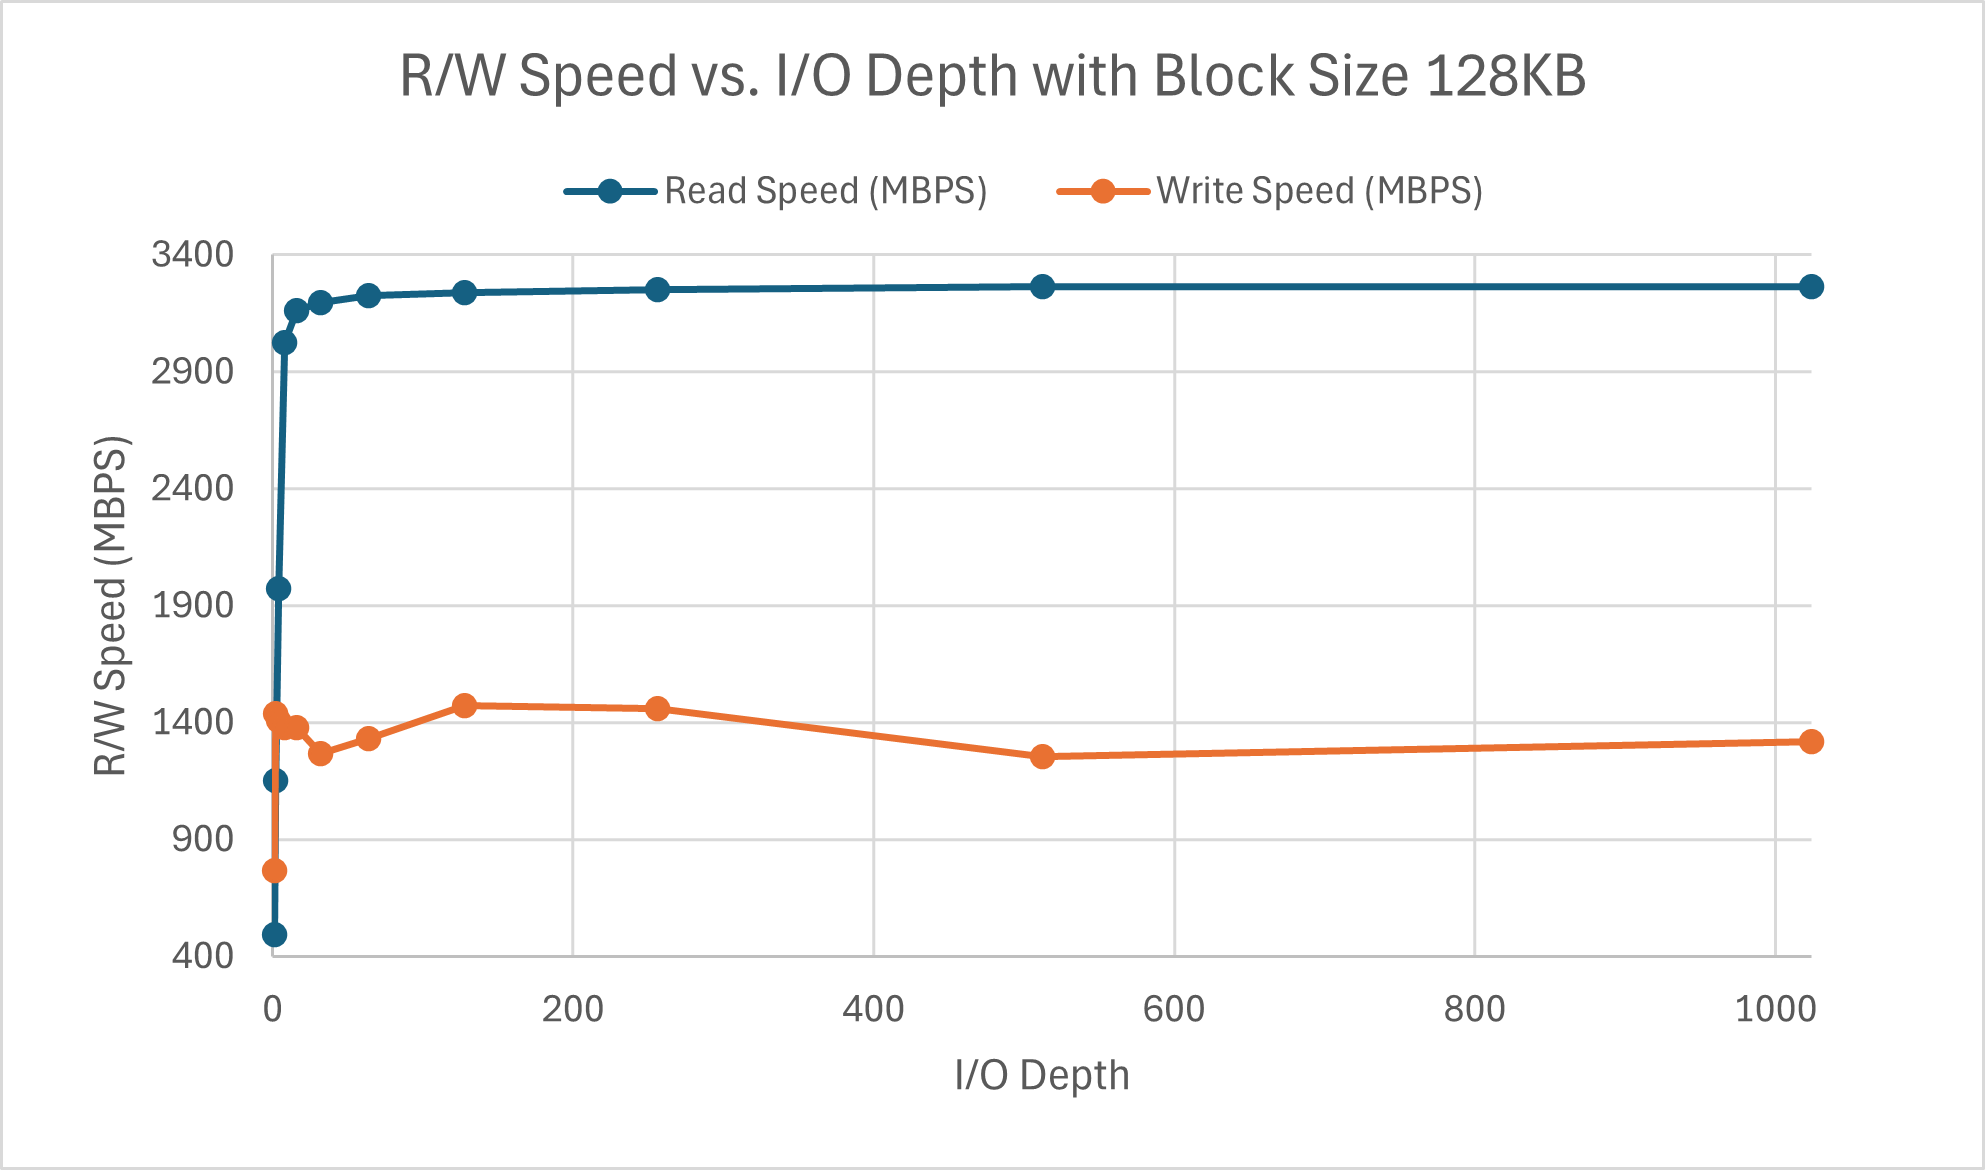
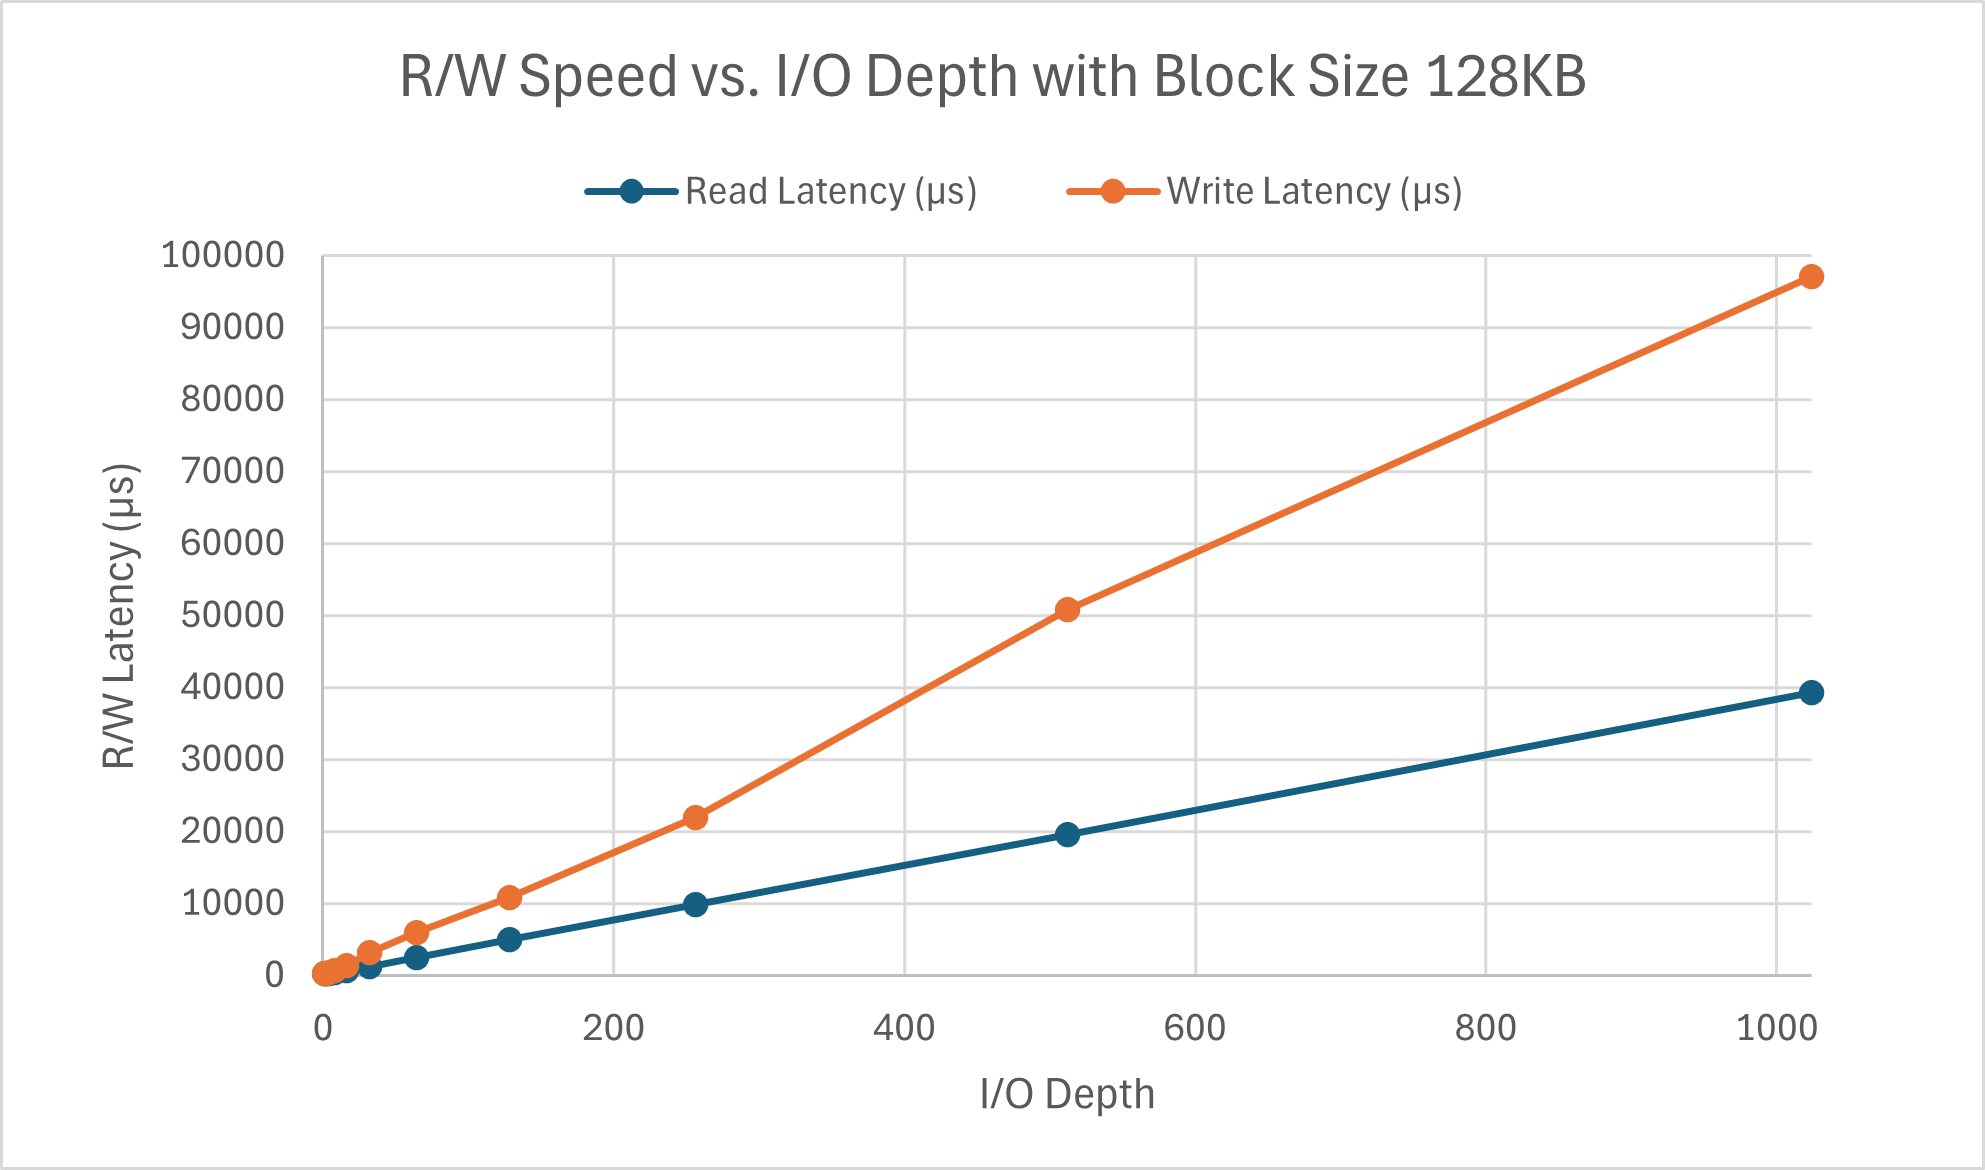
The read speed appears to approach its limit around a queue depth of 64 where as the write speed hits its maximum around a queue depth of 32. There is a peculiar divot at iodepth=32 for write speed. Something I failed to mention previously was that the other parts were tested with a queue depth of 16. I chose this value since I figured that any less would be too light, but 32 or 64 felt like a stretch for a typical workload. Seeing the perfomance here verifies my conclusion as this is on the lower end of the spectrum for block size. Latency for both read and write scales linearly with respect to I/O depth. As more operations are in the queue, the latency increases (a.k.a. latency and queue depth are positively correlated), which is exactly what queuing theory predicts.
Both operations appear to have similar latency scaling with I/O depth regardless of the block size. The difference lies in the speed wherein the read speed is hitting its peak around 16 and write peaks at a queue depth of 2, with the same divot for queue depths 4, 8, and 16. This is much faster than the 4KB counterparts.
Part 4: Comparison with Intel Data Center NVMe SSD D7-P5600 (1.6TB)
Given the performance stats of this enterprise-grade Intel SSD:
| Performance Specification | |
|---|---|
| Sequential Bandwidth (up to) 100% R | 3500 MB/s |
| Sequential Bandwidth (up to) 100% W | 1700 MB/s |
| Random Read (100% Span) | 400000 IOPS (4K Blocks) |
| Random Write (100% Span) | 118000 IOPS (4K Blocks) |
We have the parameters of the test we need run, although the results will be quite scuffed since there is no way we can match the testing parameters used to obtain those baselines. For the sake of getting closer to the capacity of the SSD in question, we will set size=2G. Additionally, the largest queue depth we tested was 128, so that gives us a block size of 16384KB to maximize the number of operations we are taking in at once. The results are shown in the table below:
| Performance Specification | |
|---|---|
| Sequential Bandwidth (up to) 100% R | 3333.2274241728514 MB/s |
| Sequential Bandwidth (up to) 100% W | 2268.3909261064455 MB/s |
| Random Read (100% Span) | 411294.689076 IOPS (4K Blocks) |
| Random Write (100% Span) | 316935.252101 IOPS (4K Blocks) |
As noted in the project description, our results may show unexpected observations. This is certainly the case for my computer. I manage to have a higher sequential bandwidth for writes, as well as higher IOPS for both random reads and writes. There are many explanations for this. Firstly, system design differences. Client facing systems tend to be dealing with smaller workloads, and thus are usually equipped with more aggressive caching systems. The priority is placed on low latency in client operations as opposed to reliability or consistency (think blue screen of death or how many people are using laptops from a decade or more ago). Enterprise systems are intended to function nonstop for years on end without failure. Secondly, since I prefer having a functional laptop and retaining the data I have on it, I cannot perform a 100% Span test for the SSD. 100% span notwithstanding, I only allocated a relatively small portion of my SSD for testing (2GB/1TB, with some degradation), meaning locality could’ve impacted performance. Tests for performance specifications also usually quite extensive, with much longer runtimes than just 60 seconds which can cause the IOPS to be lower but also result in a more stable value.